Multiple Choice
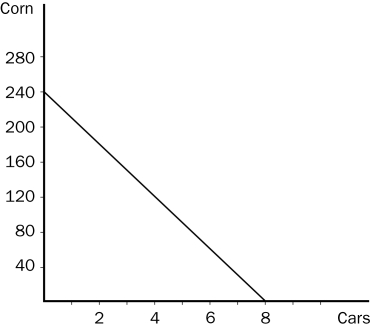
Figure 3-5 The graph below represents the various combinations of cars and corn that Country A could produce in a given month. (On the vertical axis, corn is measured in bushels.)

-Refer to Figure 3-5.For Country A,what is the opportunity cost of each additional car that it decides to produce?
A) 25 bushels of corn
B) 30 bushels of corn
C) 35 bushels of corn
D) 40 bushels of corn
Correct Answer:

Verified
Correct Answer:
Verified
Q13: A country that currently does not trade
Q27: Specialization and trade are closely linked to<br>A)absolute
Q126: Figure 3-3<br> <img src="https://d2lvgg3v3hfg70.cloudfront.net/TB2178/.jpg" alt="Figure 3-3
Q127: For the following question(s), use the accompanying
Q128: Figure 3-3<br> <img src="https://d2lvgg3v3hfg70.cloudfront.net/TB2178/.jpg" alt="Figure 3-3
Q130: Rusty can edit 2 pages in one
Q132: Figure 3-3<br> <img src="https://d2lvgg3v3hfg70.cloudfront.net/TB2178/.jpg" alt="Figure 3-3
Q133: Figure 3-2<br> <img src="https://d2lvgg3v3hfg70.cloudfront.net/TB2178/.jpg" alt="Figure 3-2
Q134: Figure 3-5 The graph below represents the
Q136: If Shawn can produce donuts at a