Multiple Choice
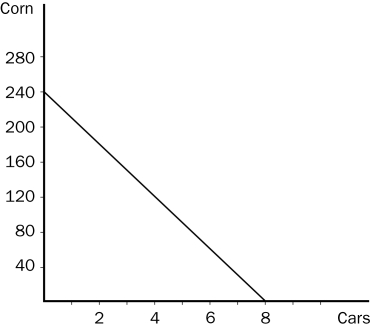
Figure 3-5 The graph below represents the various combinations of cars and corn that Country A could produce in a given month. (On the vertical axis, corn is measured in bushels.)

-Refer to Figure 3-5.Country A would most likely find itself specializing in corn production if it began trading with Country B and
A) Country A had an absolute advantage over Country B in producing corn.
B) Country B had a comparative advantage over Country A in producing corn.
C) Country B faced an opportunity cost of 20 bushels of corn for every additional car that it produced.
D) Country B faced an opportunity cost of 40 bushels of corn for every additional car that it produced.
Correct Answer:

Verified
Correct Answer:
Verified
Q39: Trade is based on absolute advantage.
Q129: Figure 3-5 The graph below represents the
Q130: Rusty can edit 2 pages in one
Q132: Figure 3-3<br> <img src="https://d2lvgg3v3hfg70.cloudfront.net/TB2178/.jpg" alt="Figure 3-3
Q133: Figure 3-2<br> <img src="https://d2lvgg3v3hfg70.cloudfront.net/TB2178/.jpg" alt="Figure 3-2
Q136: If Shawn can produce donuts at a
Q136: For the following question(s), use the accompanying
Q137: Figure 3-2<br> <img src="https://d2lvgg3v3hfg70.cloudfront.net/TB2178/.jpg" alt="Figure 3-2
Q138: Table 3-5<br> <img src="https://d2lvgg3v3hfg70.cloudfront.net/TB2178/.jpg" alt="Table 3-5
Q139: Mark is a computer company executive,earning $200