Multiple Choice
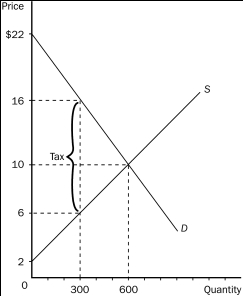
Figure 8-5

-Refer to Figure 8-5.Without a tax,consumer surplus in this market is
A) $1,500.
B) $2,400.
C) $3,000.
D) $3,600.
Correct Answer:

Verified
Correct Answer:
Verified
Q2: Figure 8-7 The graph below represents a
Q5: Which of the following statements is correct?<br>A)In
Q6: When a tax is levied on buyers,<br>A)the
Q8: Figure 8-6<br> <img src="https://d2lvgg3v3hfg70.cloudfront.net/TB2178/.jpg" alt="Figure 8-6
Q9: The amount of deadweight loss that results
Q10: Figure 8-1<br> <img src="https://d2lvgg3v3hfg70.cloudfront.net/TB2178/.jpg" alt="Figure 8-1
Q11: Figure 8-4<br> <img src="https://d2lvgg3v3hfg70.cloudfront.net/TB2178/.jpg" alt="Figure 8-4
Q12: Figure 8-5<br> <img src="https://d2lvgg3v3hfg70.cloudfront.net/TB2178/.jpg" alt="Figure 8-5
Q184: The Laffer curve is the curve showing
Q193: The demand for bread is less elastic