Multiple Choice
Figure 17-2
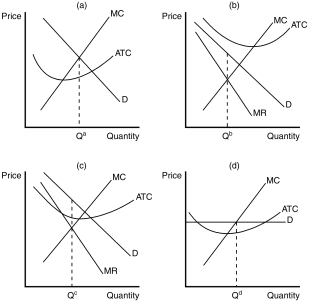
-Refer to Figure 17-2.Which of the graphs shown would be consistent with a firm in a monopolistically competitive market that is doing its best but still losing money?
A) Panel a
B) Panel b
C) Panel c
D) Panel d
Correct Answer:

Verified
Correct Answer:
Verified
Q15: In which of the following market structures
Q20: Figure 17-3<br>The lines in the figures below
Q21: Scenario 17-1<br>Vacation Inns of America (VIA) has
Q100: A firm that would experience higher average
Q126: If advertising decreases the elasticity of demand
Q136: In a long-run equilibrium, a firm in
Q153: A profit-maximizing firm in a monopolistically competitive
Q243: Assume the role of a critic of
Q392: In monopolistically competitive markets, positive economic profits<br>A)suggest
Q440: In a long-run equilibrium,<br>A)excess capacity applies to