Multiple Choice
Figure 17-3
The lines in the figures below illustrate the potential effect of entry and exit in a monopolistically competitive market on either the demand curve or the marginal cost curve of existing firms.
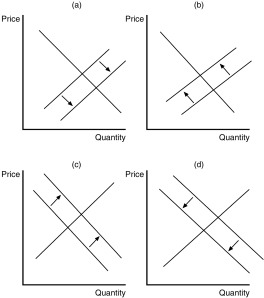
-Refer to Figure 17-3.Which of the diagrams illustrates the impact of some existing firms leaving the market?
A) Panel a
B) Panel b
C) Panel c
D) Panel d
Correct Answer:

Verified
Correct Answer:
Verified
Q15: In which of the following market structures
Q19: Figure 17-2<br> <img src="https://d2lvgg3v3hfg70.cloudfront.net/TB2178/.jpg" alt="Figure 17-2
Q21: Scenario 17-1<br>Vacation Inns of America (VIA) has
Q25: Table 17-2<br> <img src="https://d2lvgg3v3hfg70.cloudfront.net/TB2178/.jpg" alt="Table 17-2
Q100: A firm that would experience higher average
Q126: If advertising decreases the elasticity of demand
Q136: In a long-run equilibrium, a firm in
Q243: Assume the role of a critic of
Q392: In monopolistically competitive markets, positive economic profits<br>A)suggest
Q440: In a long-run equilibrium,<br>A)excess capacity applies to