Multiple Choice
The following diagram shows two budget lines: A and B. 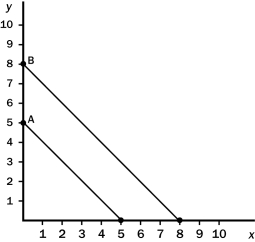
Which of the following could explain the change in the budget line from A to B?
A) A simultaneous decrease in the price of x and the price of y.
B) An increase in income.
C) An increase in income and a decrease in the price of y.
D) Both a and b
Correct Answer:

Verified
Correct Answer:
Verified
Q81: Figure 21-2<br> <img src="https://d2lvgg3v3hfg70.cloudfront.net/TB1272/.jpg" alt="Figure 21-2
Q219: Consider the indifference curve map for nickels
Q220: Which effect of a price change moves
Q221: Assume that a college student spends her
Q222: An optimizing consumer will select the consumption
Q223: Figure 21-8<br> <img src="https://d2lvgg3v3hfg70.cloudfront.net/TB2178/.jpg" alt="Figure 21-8
Q223: If an indifference curve is bowed in
Q227: Figure 21-4<br> <img src="https://d2lvgg3v3hfg70.cloudfront.net/TB2178/.jpg" alt="Figure 21-4
Q228: Good x is an inferior good,but not
Q229: At the optimum,the consumer chooses consumption of