Short Answer
Construct a frequency table:
-The following are the heights, in inches, of ten middle school basketball players. Determine the data range for the following data set. Also, construct a frequency table for the data set, use a class interval width of 2 and start with 62.5 inches. 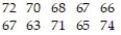
Correct Answer:

Verified
Correct Answer:
Verified
Q37: Construct a pie graph, with sectors given
Q38: Given the frequency distribution below, what is
Q39: Assume the distribution is normal. Use the
Q40: Construct a frequency polygon:<br>-<img src="https://d2lvgg3v3hfg70.cloudfront.net/TB10044/.jpg" alt="Construct a
Q41: According to a college survey, 22% of
Q43: Find the mean for the following grouped
Q44: Find the standard deviation for the following
Q45: What proportion of the following sample of
Q46: A small company employs a supervisor at
Q47: Assume the distribution is normal. Use the