Related Questions
Q35: Find the mode for the data set:<br>3,
Q36: In a certain college, 33% of the
Q37: Construct a pie graph, with sectors given
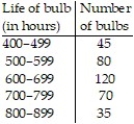
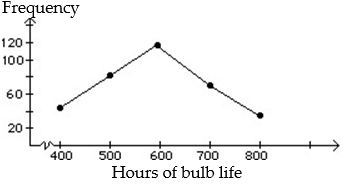
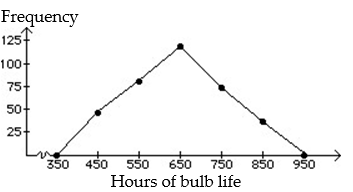
Q38: Given the frequency distribution below, what is
Q39: Assume the distribution is normal. Use the
Q41: According to a college survey, 22% of
Q42: Construct a frequency table:<br>-The following are the
Q43: Find the mean for the following grouped
Q44: Find the standard deviation for the following
Q45: What proportion of the following sample of