Multiple Choice
Construct a bar graph of the given frequency distribution:
-The frequency distribution indicates the number of fish caught by each fisherman in a group of 250 fishermen. 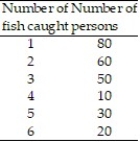
A) 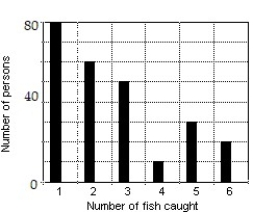
B) 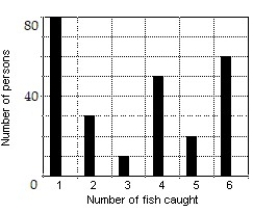
C) 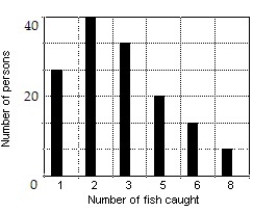
D) 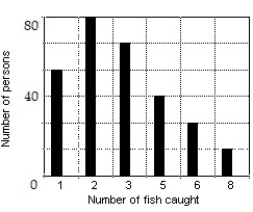
Correct Answer:

Verified
Correct Answer:
Verified
Q22: Following is a sample of the percent
Q23: The frequency distribution below gives the weight
Q24: If a baseball player has a batting
Q25: Given a normal distribution with mean 120
Q26: Here are the commutes (in miles) for
Q28: Evaluate <img src="https://d2lvgg3v3hfg70.cloudfront.net/TB10044/.jpg" alt="Evaluate for
Q29: The life expectancy (in hours) of a
Q30: Construct a broken-line graph of the data
Q31: Given a normal distribution with mean 120
Q32: Evaluate <img src="https://d2lvgg3v3hfg70.cloudfront.net/TB10044/.jpg" alt="Evaluate for