Short Answer
Construct a broken-line graph of the data in the table:
-The following table gives the total amount of precipitation during the given months. Use time on the horizontal scale for your line graph. 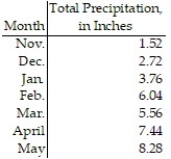
Correct Answer:

Verified
Answers ma...View Answer
Unlock this answer now
Get Access to more Verified Answers free of charge
Correct Answer:
Verified
View Answer
Unlock this answer now
Get Access to more Verified Answers free of charge
Q25: Given a normal distribution with mean 120
Q26: Here are the commutes (in miles) for
Q27: Construct a bar graph of the given
Q28: Evaluate <img src="https://d2lvgg3v3hfg70.cloudfront.net/TB10044/.jpg" alt="Evaluate for
Q29: The life expectancy (in hours) of a
Q31: Given a normal distribution with mean 120
Q32: Evaluate <img src="https://d2lvgg3v3hfg70.cloudfront.net/TB10044/.jpg" alt="Evaluate for
Q33: Construct a pie graph, with sectors given
Q34: Construct a pie graph, with sectors given
Q35: Find the mode for the data set:<br>3,