Multiple Choice
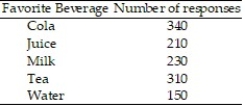
Construct a pie graph, with sectors given in percent, to represent the data in the given table:
-

A) 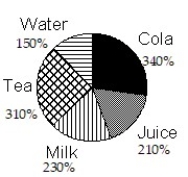
B) 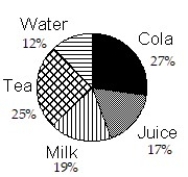
C) 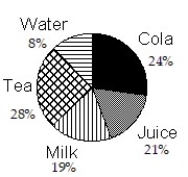
D) 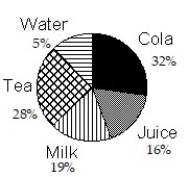
Correct Answer:

Verified
Correct Answer:
Verified
Related Questions
Q28: Evaluate <img src="https://d2lvgg3v3hfg70.cloudfront.net/TB10044/.jpg" alt="Evaluate for
Q29: The life expectancy (in hours) of a
Q30: Construct a broken-line graph of the data
Q31: Given a normal distribution with mean 120
Q32: Evaluate <img src="https://d2lvgg3v3hfg70.cloudfront.net/TB10044/.jpg" alt="Evaluate for
Q34: Construct a pie graph, with sectors given
Q35: Find the mode for the data set:<br>3,
Q36: In a certain college, 33% of the
Q37: Construct a pie graph, with sectors given
Q38: Given the frequency distribution below, what is