Multiple Choice
Use the information contained in this chart to determine your answer. Twenty samples of size 8 were taken from a stable process. From past studies of the process, you know that the overall mean is 42.5 and that the average of the samples range is 2.0.
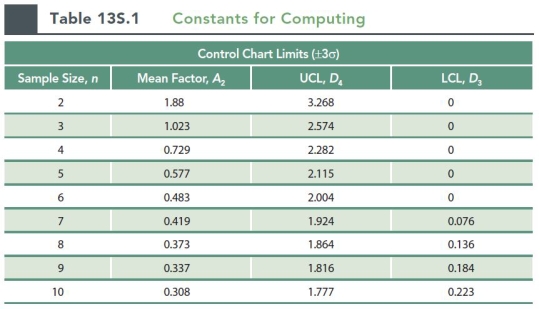
-The LCL for the three sigma R chart for the process is approximately (for a sample size of 8, D3 = 0.136, D4 = 1.864) :
A) 2.00
B) 0.45
C) 0.27
D) 3.55
E) 3.73
Correct Answer:

Verified
Correct Answer:
Verified
Q14: A drive-in restaurant is running a new
Q15: A product has 175 parts, the company
Q16: A cell phone manufacturer inspects the video
Q17: A company currently produced 750,000 units, with
Q18: You have been given the following data:<br>Specification
Q20: Oliver's pizza shop tracks customer complaints every
Q21: A drive-in restaurant is running a new
Q22: Romeo and Juliet make and sell cookies
Q23: A drive-in restaurant is running a new
Q24: Sample means and ranges were obtained for