Multiple Choice
A company has the data shown in the chart below concerning its forecast performance over the past five time periods.
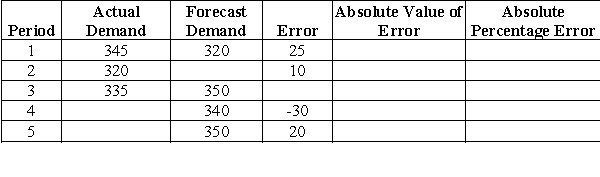
-Calculate the mean absolute deviation (MAD) .
A) 0.00
B) 10.00
C) 20.00
D) 100.00
E) Need more information to answer the question
Correct Answer:

Verified
Correct Answer:
Verified
Related Questions
Q29: A company has the data shown in
Q30: A well-educated lumberjack decides to use linear
Q31: A company has the data shown in
Q32: A company has the information shown in
Q33: Given the series of demand data below<br>
Q35: A firm's demand data from the last
Q36: Given the series of demand data below<br>
Q37: <img src="https://d2lvgg3v3hfg70.cloudfront.net/TBR4941/.jpg" alt=" -Over a six-month
Q38: Given the series of demand data below<br>
Q39: Given the series of demand data below<br>