True/False
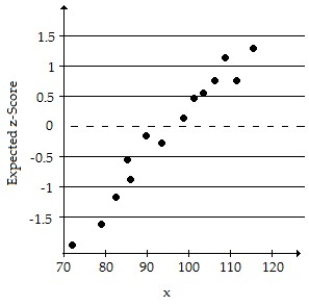
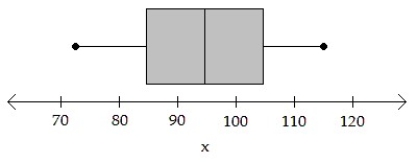
A simple random sample of size n < 30 for a quantitative variable has been obtained. Using the normal probability plot, the correlation between the variable and expected z-score, and the boxplot, judge whether a t-interval should be constructed.
-n = 14; Correlation = 0.956
Correct Answer:

Verified
Correct Answer:
Verified
Q10: Find the t-value.<br>-Find the t-value such that
Q11: In a random sample of 60 dog
Q12: A confidence interval for p can be
Q13: A survey of 1010 college seniors working
Q14: A computer package was used to generate
Q16: Determine the critical value <img src="https://d2lvgg3v3hfg70.cloudfront.net/TB10223/.jpg" alt="Determine
Q17: Construct a 95% Z-interval or a 95%
Q18: An article a Florida newspaper reported on
Q19: Construct a 95% Z-interval or a 95%
Q20: In order to set rates, an insurance