Multiple Choice
Use a normal probability plot to asses whether the sample data could have come from a population that is normally distributed.
-An industrial psychologist conducted an experiment in which 40 employees that were identified as "chronically tardy" by their managers were divided into two groups of size 20. Group 1 participated in the new "It's Great to be Awake!" program, while Group 2 had their pay pay docked. The following data represent the number of minutes that employees in Group 1 were late for work after participating in the program. 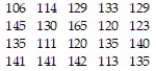
A) not normally distributed
B) normally distributed
Correct Answer:

Verified
Correct Answer:
Verified
Q2: Find the indicated z-score.<br>-Find the z-score for
Q3: Find the sum of the areas under
Q4: Find the indicated z-score.<br>-Find the z-scores for
Q5: Find the indicated probability.<br>-Assume that the random
Q6: Find the indicated probability.<br>-Assume that the random
Q7: Find the indicated z-score.<br>-Determine the two z-scores
Q8: Find the value of. <img src="https://d2lvgg3v3hfg70.cloudfront.net/TB10223/.jpg" alt="Find
Q9: The amount of soda a dispensing machine
Q10: Determine the area under the standard normal
Q11: Find the indicated z-score.<br>-Determine the two z-scores