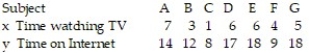
Multiple Choice
Make a scatter diagram for the data. Use the scatter diagram to describe how, if at all, the variables are related.
-
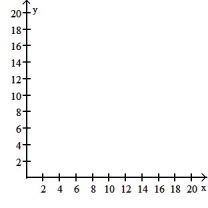
A) The variables do not appear to be linearly related. 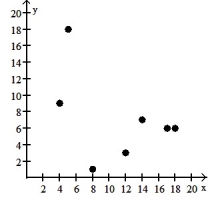
B) The variables appear to be positively, linearly related. 
C) The variables do not appear to be linearly related. 
D) The variables appear to be negatively, linearly related. 
Correct Answer:

Verified
Correct Answer:
Verified
Q61: Find the equation of the regression line
Q62: The regression line for the given data
Q63: Given the equation of a regression line
Q64: Use the scatter diagrams shown, labeled a
Q65: A traffic officer is compiling information about
Q67: Choose the coefficient of determination that matches
Q68: The regression line for the given data
Q69: A scatter diagram is given with one
Q70: To investigate the relationship between yield of
Q71: The data below are the average one-way