Multiple Choice
Use the scatter diagrams shown, labeled a through f to solve the problem.
-In which scatter diagram is r = 0.01? 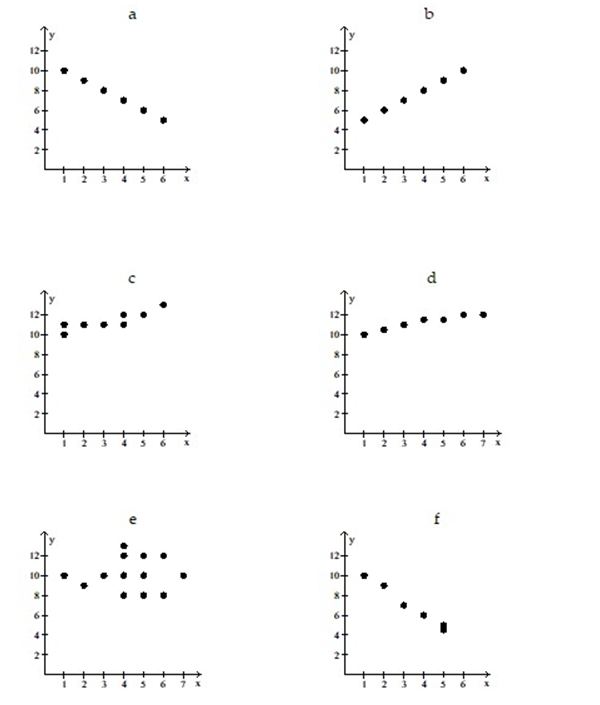
A) d
B) c
C) e
D) f
Correct Answer:

Verified
Correct Answer:
Verified
Related Questions
Q59: A manager wishes to determine the relationship
Q60: The data below are the number of
Q61: Find the equation of the regression line
Q62: The regression line for the given data
Q63: Given the equation of a regression line
Q65: A traffic officer is compiling information about
Q66: Make a scatter diagram for the data.
Q67: Choose the coefficient of determination that matches
Q68: The regression line for the given data
Q69: A scatter diagram is given with one