Essay
The data below represent the numbers of absences and the final grades of 15 randomly selected students from an astronomy class. Construct a scatter diagram for the data. Do you detect a trend? 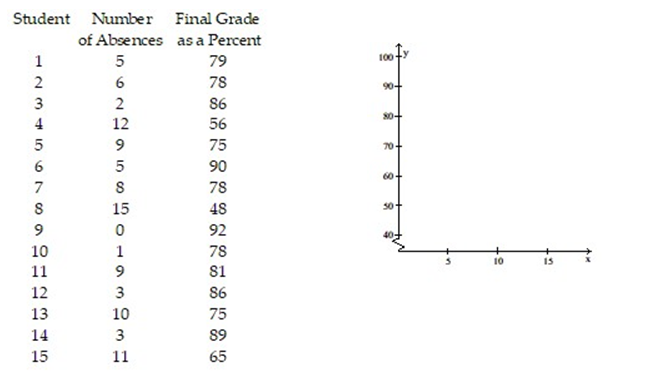
Correct Answer:

Verified
There appears to be a trend in...View Answer
Unlock this answer now
Get Access to more Verified Answers free of charge
Correct Answer:
Verified
View Answer
Unlock this answer now
Get Access to more Verified Answers free of charge
Q14: Compute the linear correlation coefficient between the
Q15: Choose the coefficient of determination that matches
Q16: In one area of Russia, records were
Q17: Construct a frequency marginal distribution for the
Q18: A history instructor has given the same
Q20: Calculate the linear correlation coefficient for the
Q21: Analyze the residual lot below. Does it
Q22: Compute the linear correlation coefficient between the
Q23: A county real estate appraiser wants to
Q24: The data below show the age and