Essay
In a comprehensive road test on all new car models, one variable measured is the time it takes a car to accelerate from 0 to 60 miles per hour. To model acceleration time, a regression analysis is conducted on a random sample of 129 new cars.
TIME60: y = Elapsed time (in seconds) from 0 mph to 60 mph
MAX:  = Maximum speed attained (miles per hour)
Initially, the simple linear model E(y) =  +
+ 
 was fit to the data. Computer printouts for the analysis are given below:
 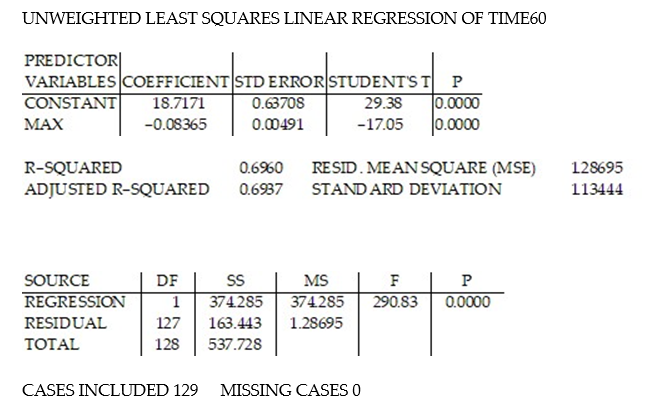 Find and interpret the estimate
  in the printout above.
Correct Answer:

Verified
 =-0.08365. For every 1 mile p...
View Answer
Unlock this answer now
Get Access to more Verified Answers free of charge
Correct Answer:
Verified
View Answer
Unlock this answer now
Get Access to more Verified Answers free of charge
Q44: A company encourages applications from minority groups
Q45: Find the equation of the regression line
Q46: In an area of the Great Plains,
Q47: The regression line for the given data
Q48: A contingency table relates<br>A) the difference in
Q50: The regression line for the given data
Q51: Use the regression equation to predict the
Q52: Compute the sum of the squared residuals
Q53: Construct a scatter diagram for the data.<br>-In
Q54: Construct a relative frequency marginal distribution for