Essay
A company encourages applications from minority groups who they feel are under-represented in the company. The table shows the number of applications that were accepted last year from people belonging to minority groups and the number of applications that were accepted from people not belonging to minority groups. Only applications from well qualified applicants are included in the analysis.
(a) Does the acceptance rate appear to be higher for those belonging to minority groups or for those not belonging to minority groups ? Why? 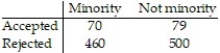 The data in the table do not take into account the department of the company. The data shown in the next table show the number of applications accepted from each group within each department.Department A Department B Department C
 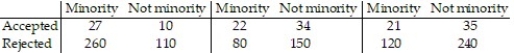 (b) Determine the proportion of minority applications that were accepted within department A. Determine the proportion of non-minority applications that were accepted within department A.
(c) Repeat part (b) for departments B and C to create a conditional distribution of acceptance rate by group for each department of the company.
(d) Write a short report detailing and explaining your findings.
Correct Answer:

Verified
(a) The acceptance rate appears to be hi...View Answer
Unlock this answer now
Get Access to more Verified Answers free of charge
Correct Answer:
Verified
View Answer
Unlock this answer now
Get Access to more Verified Answers free of charge
Q39: Find the equation of the regression line
Q40: In a study of feeding behavior, zoologists
Q41: A calculus instructor is interested in finding
Q42: In a comprehensive road test on all
Q43: The regression line for the given data
Q45: Find the equation of the regression line
Q46: In an area of the Great Plains,
Q47: The regression line for the given data
Q48: A contingency table relates<br>A) the difference in
Q49: In a comprehensive road test on all