Multiple Choice
Annual measurements of the number of powerboat registrations (in thousands) and the number of manatees killed by powerboats in Florida were collected over the 14 years 1977-1990. A scatterplot of the data, least squares regression line, and correlation coefficient follow. 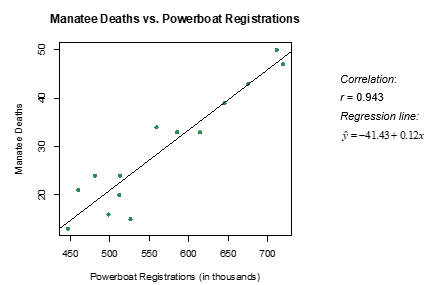
-How would you interpret the slope of the regression line in the context of the problem? Select all that apply.
A) Every 8,000 powerboat registrations is associated with a predicted increase of one manatee death.
B) We predict an additional 0.12 manatee death for each single powerboat registration.
C) We predict an additional 0.12 manatee death for every 1,000 powerboats registered.
D) We predict a decrease of 41.43 manatee deaths for every 1,000 powerboats registered.
Correct Answer:

Verified
Correct Answer:
Verified
Q26: It is commonly expected that as a
Q27: Babies born with low birth weights (less
Q28: Annual measurements of the number of powerboat
Q29: How is the number of pages in
Q30: Are people with bigger brains more intelligent?
Q32: It is commonly expected that as a
Q33: Data from the World Bank for 25
Q34: Data from the World Bank for 25
Q35: Data from gapminder.org on 184 countries was
Q36: The following scatterplot displays the finish time