Multiple Choice
It is commonly expected that as a person ages, their muscle mass decreases. To further examine this relationship in women, a nutritionist randomly selected 60 female patients from her clinic, 15 women from each 10-year age group beginning with age 40 and ending with age 80. For each patient, her age and current muscle mass was recorded. A scatterplot, least squares regression line, and coefficient of determination are as follows. 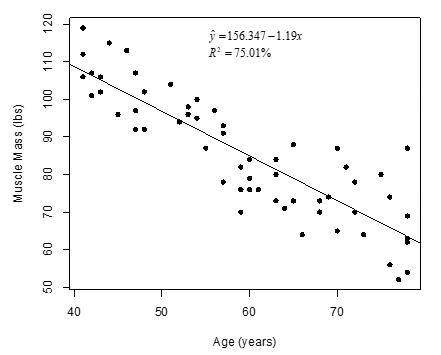
-Which of the following is a correct interpretation of the coefficient of determination?
A) When the age of a woman is equal to zero, her predicted muscle mass is 75.01 lbs.
B) The correlation coefficient between age and muscle mass is equal to 0.7501.
C) Each additional year in age is associated with a 75.01% decrease in predicted muscle mass.
D) Approximately 75.01% of the variation in muscle mass can be explained by changes in age among these women.
Correct Answer:

Verified
Correct Answer:
Verified
Q27: Babies born with low birth weights (less
Q28: Annual measurements of the number of powerboat
Q29: How is the number of pages in
Q30: Are people with bigger brains more intelligent?
Q31: Annual measurements of the number of powerboat
Q33: Data from the World Bank for 25
Q34: Data from the World Bank for 25
Q35: Data from gapminder.org on 184 countries was
Q36: The following scatterplot displays the finish time
Q37: Data from gapminder.org on 184 countries was