Multiple Choice
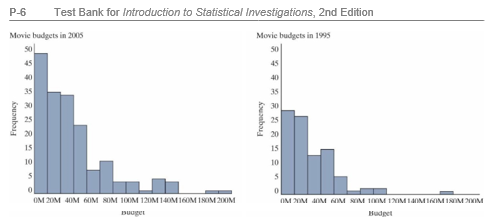
The plots below were created using a data set containing information about movies re-leased in 1995 and 2005. Note: M = million. 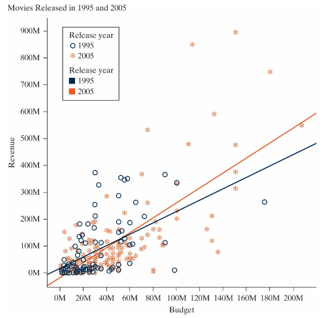
-Which year had a higher mean movie revenue?
A) 1995
B) 2005
C) The two years had the same mean movie revenue.
D) This cannot be determined from the information given.
Correct Answer:

Verified
Correct Answer:
Verified
Q36: An environmental science teacher at a high
Q37: A histogram that has the majority of
Q38: Researchers investigated whether larger bowls increase the
Q39: The plots below were created using a
Q40: Many football bets include a "point-spread" so
Q42: The following plots display data exam scores
Q43: Which of the following variables are likely
Q44: A student participates in a Coke versus
Q45: The following plots display data exam scores
Q46: The plots below were created using a