Multiple Choice
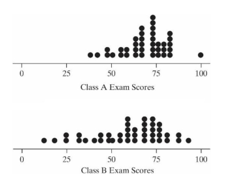
The following plots display data exam scores for two different statistics classes. 
-Does there appear to be any outliers in the two classes?
A) There are no outliers in either class.
B) There is at least one outlier in Class A and at least one outlier in Class B
C) There are no outliers in Class A, but at least one outlier in Class B
D) There are no outliers in Class B, but at least one outlier in Class A
Correct Answer:

Verified
Correct Answer:
Verified
Q36: An environmental science teacher at a high
Q37: A histogram that has the majority of
Q38: Researchers investigated whether larger bowls increase the
Q39: The plots below were created using a
Q40: Many football bets include a "point-spread" so
Q41: The plots below were created using a
Q42: The following plots display data exam scores
Q43: Which of the following variables are likely
Q44: A student participates in a Coke versus
Q46: The plots below were created using a