Multiple Choice
The following summary statistics and two dotplots display data on 64 used textbooks. The price of each used textbook was recorded from the University of California, Los Angeles (UCLA) campus bookstore and from Amazon. 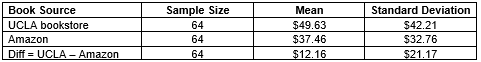
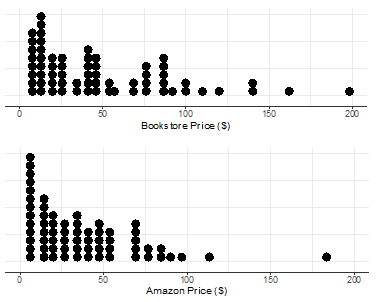
-Which applet should you use to perform a simulation-based hypothesis test for these data?
A) One Proportion
B) Two Proportions
C) One Mean
D) Multiple Means
E) Matched Pairs
Correct Answer:

Verified
Correct Answer:
Verified
Q14: A random sample of medical records from
Q15: Patients with chronic obstruction pulmonary disease (COPD)
Q16: Researchers randomly selected 36 children who had
Q17: A past statistics project investigated how well
Q18: Researchers randomly assigned patients with severe acne
Q20: Researchers randomly selected 36 children who had
Q21: A past statistics project investigated how well
Q22: A past statistics project investigated how well
Q23: Patients with chronic obstruction pulmonary disease (COPD)
Q24: A Pew Research Center poll randomly selected