Short Answer
A past statistics project investigated how well college students perceive their own attractiveness. Twenty college students were recruited to participate in the study. As part of the study, each student rated their own attractiveness on a scale from 1 - 10. Each of the 20 participants also agreed to have their picture taken. All pictures were taken in similar lighting. In the second part of the study, a group of 79 college student volunteers (who were not part of the original group of 20) agreed to rate the attractiveness of each of the people in the pictures on a scale of 1 - 10. Researchers then averaged the attractiveness rating of the 79 "raters" (referred to as the societal rating) to compare to the self-rating to determine whether or not college students are accurate in their self-perceptions. The average difference in attractiveness ratings (self - societal) in the sample was 1.066 with a standard deviation of 1.507. A dotplot of these differences follows. 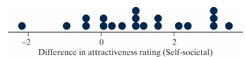
-Calculate the standardized statistic for these data.
Correct Answer:

Verified
Correct Answer:
Verified
Q12: A past statistics project investigated how well
Q13: The following summary statistics and two dotplots
Q14: A random sample of medical records from
Q15: Patients with chronic obstruction pulmonary disease (COPD)
Q16: Researchers randomly selected 36 children who had
Q18: Researchers randomly assigned patients with severe acne
Q19: The following summary statistics and two dotplots
Q20: Researchers randomly selected 36 children who had
Q21: A past statistics project investigated how well
Q22: A past statistics project investigated how well