Multiple Choice
The graphs of f
and  are shown at the right.
 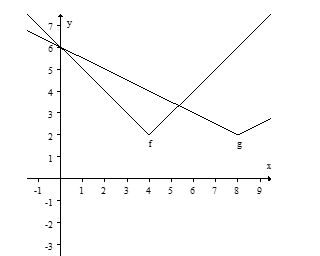 .
.
Which of the following gives a formula for  in terms of
  ?
?
A) 
B) 
C) 
D) 
Correct Answer:

Verified
Correct Answer:
Verified
Q12: Let 4 and -4 be the zeros
Q13: The following table gives values for <img
Q14: The average rate of change of <img
Q15: Graph <img src="https://d2lvgg3v3hfg70.cloudfront.net/TB10073/.jpg" alt="Graph
Q16: Sketch the graph of <img src="https://d2lvgg3v3hfg70.cloudfront.net/TB10073/.jpg"
Q18: The graph of <img src="https://d2lvgg3v3hfg70.cloudfront.net/TB10073/.jpg" alt="The
Q19: Given the graph of <img src="https://d2lvgg3v3hfg70.cloudfront.net/TB10073/.jpg" alt="Given
Q20: Let <img src="https://d2lvgg3v3hfg70.cloudfront.net/TB10073/.jpg" alt="Let represent
Q21: If <img src="https://d2lvgg3v3hfg70.cloudfront.net/TB10073/.jpg" alt="If for
Q22: Suppose the range of <img src="https://d2lvgg3v3hfg70.cloudfront.net/TB10073/.jpg"