Related Questions
Q11: Below is a graph of the function
Q12: Let 4 and -4 be the zeros
Q13: The following table gives values for <img
Q14: The average rate of change of <img
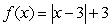
Q15: Graph <img src="https://d2lvgg3v3hfg70.cloudfront.net/TB10073/.jpg" alt="Graph
Q17: The graphs of f<br> and <img src="https://d2lvgg3v3hfg70.cloudfront.net/TB10073/.jpg"
Q18: The graph of <img src="https://d2lvgg3v3hfg70.cloudfront.net/TB10073/.jpg" alt="The
Q19: Given the graph of <img src="https://d2lvgg3v3hfg70.cloudfront.net/TB10073/.jpg" alt="Given
Q20: Let <img src="https://d2lvgg3v3hfg70.cloudfront.net/TB10073/.jpg" alt="Let represent
Q21: If <img src="https://d2lvgg3v3hfg70.cloudfront.net/TB10073/.jpg" alt="If for