Short Answer
The following tables give the profits (in millions) of a manufacturing company  months after January 1, 2008.
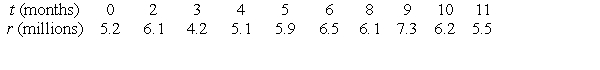 Use a calculator program to find the regression line for this data. What is the physical interpretation of the t-intercept?
Correct Answer:

Verified
The time, in months ...View Answer
Unlock this answer now
Get Access to more Verified Answers free of charge
Correct Answer:
Verified
View Answer
Unlock this answer now
Get Access to more Verified Answers free of charge
Q91: Find a formula for the linear function
Q92: Could the following table represent a linear
Q93: What is the equation of the line
Q94: Let <img src="https://d2lvgg3v3hfg70.cloudfront.net/TB10073/.jpg" alt="Let
Q95: Is the function graphed in the following
Q97: Let <img src="https://d2lvgg3v3hfg70.cloudfront.net/TB10073/.jpg" alt="Let
Q98: Could the following table represent a linear
Q99: Suppose that <img src="https://d2lvgg3v3hfg70.cloudfront.net/TB10073/.jpg" alt="Suppose that
Q100: Several years ago, the wild rabbits of
Q101: Suppose there are 110 people living in