Short Answer
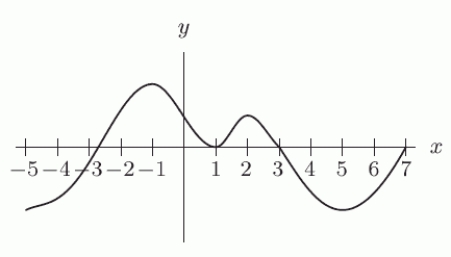
Is the function graphed in the following figure increasing or decreasing on the interval 5 < x < 7?
Correct Answer:

Verified
Correct Answer:
Verified
Related Questions
Q90: The following figure shows the graph of
Q91: Find a formula for the linear function
Q92: Could the following table represent a linear
Q93: What is the equation of the line
Q94: Let <img src="https://d2lvgg3v3hfg70.cloudfront.net/TB10073/.jpg" alt="Let
Q96: The following tables give the profits (in
Q97: Let <img src="https://d2lvgg3v3hfg70.cloudfront.net/TB10073/.jpg" alt="Let
Q98: Could the following table represent a linear
Q99: Suppose that <img src="https://d2lvgg3v3hfg70.cloudfront.net/TB10073/.jpg" alt="Suppose that
Q100: Several years ago, the wild rabbits of