Multiple Choice
Which of the following figures shows the graph of a person's weight, w, as a function of time t, in months if the person starts out at 150 pounds and loses 10 pounds a month?
A) 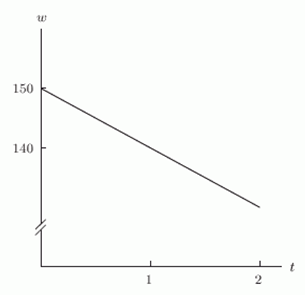
B) 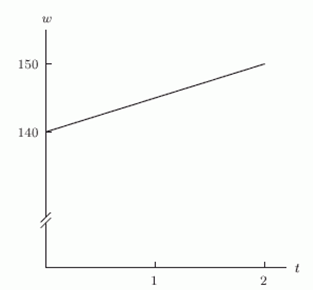
C) 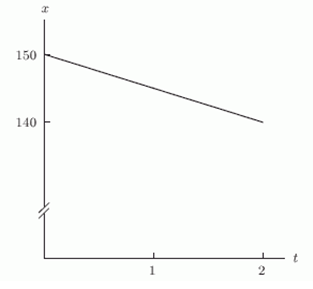
D) 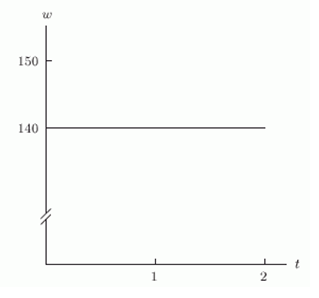
Correct Answer:

Verified
Correct Answer:
Verified
Related Questions
Q72: Calculate the average rate of change of
Q73: Using the following figure, find the average
Q74: Could the following table represent a linear
Q75: At a price of $2.65 per gallon,
Q76: If <img src="https://d2lvgg3v3hfg70.cloudfront.net/TB10073/.jpg" alt="If is
Q78: Use the following table to find
Q79: A certain baseball card's value is given
Q80: The distance traveled by a car is
Q81: At a price of $3.00 per gallon,
Q82: Let <img src="https://d2lvgg3v3hfg70.cloudfront.net/TB10073/.jpg" alt="Let