Short Answer
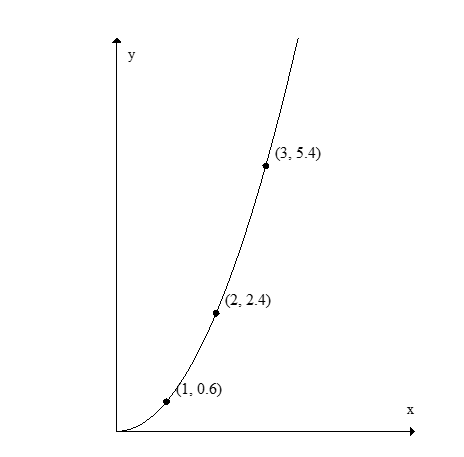
Using the following figure, find the average rate of change of f for

Correct Answer:

Verified
Correct Answer:
Verified
Related Questions
Q68: If a linear population function is 60,000
Q69: The following table shows the cost of
Q70: Consider the information in the following table.<br>
Q71: The following table shows the relationship between
Q72: Calculate the average rate of change of
Q74: Could the following table represent a linear
Q75: At a price of $2.65 per gallon,
Q76: If <img src="https://d2lvgg3v3hfg70.cloudfront.net/TB10073/.jpg" alt="If is
Q77: Which of the following figures shows the
Q78: Use the following table to find