Multiple Choice
The following figure shows the graph of  Estimate
Between x = 10 and x = 15.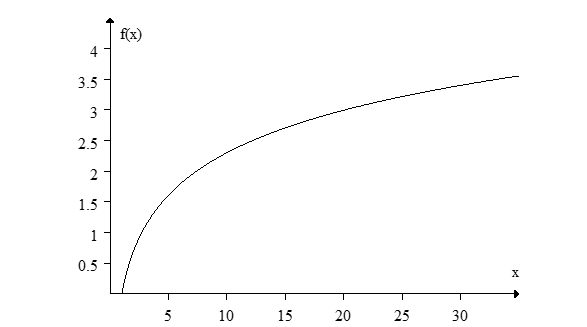
A) 0.08
B) 0.68
C) 1.98
D) -0.08
Correct Answer:

Verified
Correct Answer:
Verified
Related Questions
Q85: Calculate the average rate of change for
Q86: A car company has found that there
Q87: A wildlife ranger finds that there is
Q88: Suppose that <img src="https://d2lvgg3v3hfg70.cloudfront.net/TB10073/.jpg" alt="Suppose that
Q89: The population of a pack of rats
Q91: Find a formula for the linear function
Q92: Could the following table represent a linear
Q93: What is the equation of the line
Q94: Let <img src="https://d2lvgg3v3hfg70.cloudfront.net/TB10073/.jpg" alt="Let
Q95: Is the function graphed in the following