Short Answer
The frequency table below describes the age distribution of students in a college algebra class. Based on this information, estimate the largest and smallest possible values for the mean age of this class.
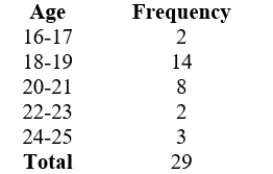
A) Find the smallest possible meanand
and
B) the largest possible mean.Round your answers to 2 decimals if necessary.
Correct Answer:

Verified
A. 19. 31 ...View Answer
Unlock this answer now
Get Access to more Verified Answers free of charge
Correct Answer:
Verified
View Answer
Unlock this answer now
Get Access to more Verified Answers free of charge
Q128: Find the median of the data set
Q129: For the equation:<br> <img src="https://d2lvgg3v3hfg70.cloudfront.net/TB9987/.jpg" alt="For the
Q130: Which of the following CANNOT be the
Q131: Use the graph below to answer the
Q132: Determine if this graph represents a function
Q134: The following graph shows the populations (in
Q135: For the following data:<br>64, 63, 72, 75,
Q136: Determine if this set of points represents
Q137: Below is a pie chart of the
Q138: Find an equation that represents the relationship