Multiple Choice
Use the graph below to answer the questions.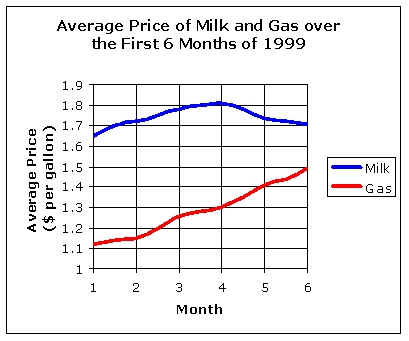
-
After which month did milk prices begin to decrease?
A) 2
B) 5
C) 4
D) 3
Correct Answer:

Verified
Correct Answer:
Verified
Related Questions
Q126: On what interval is this graph decreasing.
Q127: Find the domain of the function, <img
Q128: Find the median of the data set
Q129: For the equation:<br> <img src="https://d2lvgg3v3hfg70.cloudfront.net/TB9987/.jpg" alt="For the
Q130: Which of the following CANNOT be the
Q132: Determine if this graph represents a function
Q133: The frequency table below describes the age
Q134: The following graph shows the populations (in
Q135: For the following data:<br>64, 63, 72, 75,
Q136: Determine if this set of points represents