Short Answer
The table shows starting salaries from a survey of recent college graduates:
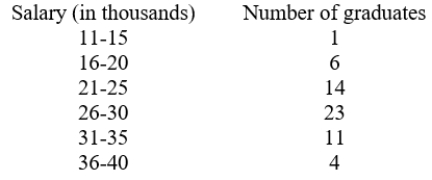
What is the relative frequency of a graduate having a salary between $16,000 and $20,000?
Round your answer to 2 decimal places.
Correct Answer:

Verified
Correct Answer:
Verified
Related Questions
Q27: Find an equation that represents the relationship
Q28: Jeremy has instructed his accountant to split
Q29: On what interval is this graph decreasing.
Q30: Use the following to answer questions <br>The
Q31: Use technology to graph the function and
Q33: The following table gives values for a
Q34: Use the following to answer questions <br>The
Q35: Which graph most likely illustrates the average
Q36: The histogram below was created use the
Q37: In a group of seven people the