Multiple Choice
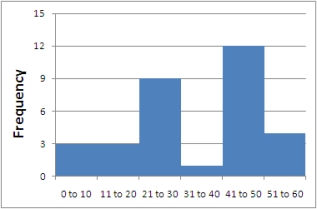
The histogram below was created use the ages of members of a certain family. Find the relative frequency of the family members in the 31-40 age range.
A) 3.125%
B) 1
C) 1%
D) 35
Correct Answer:

Verified
Correct Answer:
Verified
Related Questions
Q31: Use technology to graph the function and
Q32: The table shows starting salaries from a
Q33: The following table gives values for a
Q34: Use the following to answer questions <br>The
Q35: Which graph most likely illustrates the average
Q37: In a group of seven people the
Q38: Over what interval is the function concave
Q39: Find the value that correctly completes the
Q40: Which graph displays the solutions to the
Q41: Find f(-4) for the function f(x) =