Short Answer
The bar chart below was created using the number of children of each of the last 20 U.S. Presidents.
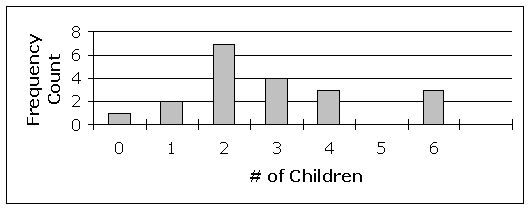
Find the relative frequency of presidents who had 3 children.
Correct Answer:

Verified
Correct Answer:
Verified
Related Questions
Q53: Find the domain of the function, <img
Q54: Find a formula that gives y in
Q55: The frequency table below describes the age
Q56: Use the bar chart below to find
Q57: Find the value that completes the ordered
Q59: Which one of the following ordered pairs
Q60: Find the median of the data set
Q61: The 1999 graduates of Bottom Line University
Q62: In the graph below, y is a
Q63: The following table gives values for a