Multiple Choice
The frequency table below describes the age distribution of students in a college algebra class. Based on this information, estimate the smallest possible value for the mean age of this class.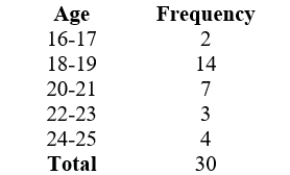
Which of the following is the smallest possible mean?
Round your answers to 2 decimals if necessary.
A) 19.53
B) 20.53
C) 20.03
D) 18.5
Correct Answer:

Verified
Correct Answer:
Verified
Q50: Solve the following equation for y in
Q51: The 2006 graduates of Bottom Line University
Q52: Each of these tanks is being filled
Q53: Find the domain of the function, <img
Q54: Find a formula that gives y in
Q56: Use the bar chart below to find
Q57: Find the value that completes the ordered
Q58: The bar chart below was created using
Q59: Which one of the following ordered pairs
Q60: Find the median of the data set