Multiple Choice
The bar chart below was created using the number of children of each of the last 20 U.S. Presidents.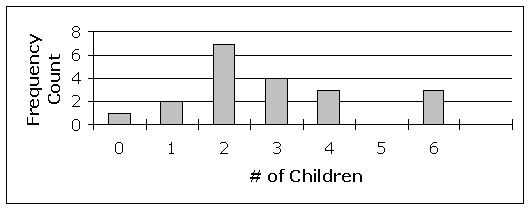
Find the relative frequency of presidents who had 1 children.
A) 10%
B) 2
C) 1
D) 20%
Correct Answer:

Verified
Correct Answer:
Verified
Related Questions
Q84: The following three graphs describe two cars,
Q85: Over what interval is the function concave
Q86: The following grid shows the graph of
Q87: Jeremy has instructed his accountant to split
Q88: If the tank pictured here is filled
Q90: Over what interval is the function concave
Q91: Use technology to graph the function and
Q92: The following grid shows the graph of
Q93: For the following data:<br>61, 59, 77, 71,
Q94: Which two values are excluded from the