Essay
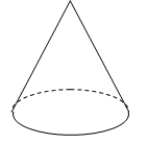
If the tank pictured here is filled with a pipe flowing at a constant rate, sketch the graph of the height of the water in the tank as a function of time.
Correct Answer:

Verified
Correct Answer:
Verified
Related Questions
Q83: Find each of the following for the
Q84: The following three graphs describe two cars,
Q85: Over what interval is the function concave
Q86: The following grid shows the graph of
Q87: Jeremy has instructed his accountant to split
Q89: The bar chart below was created using
Q90: Over what interval is the function concave
Q91: Use technology to graph the function and
Q92: The following grid shows the graph of
Q93: For the following data:<br>61, 59, 77, 71,