Short Answer
The following table shows data for the number of speeding tickets issued and the number of traffic deaths in Barron County by year.
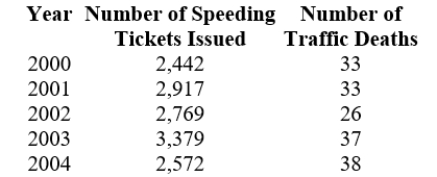
In which year were there the most traffic deaths?
Correct Answer:

Verified
Correct Answer:
Verified
Related Questions
Q93: For the following data:<br>61, 59, 77, 71,
Q94: Which two values are excluded from the
Q95: Use technology to graph the function and
Q96: Find the median of the data set
Q97: Find the domain for this function. Express
Q99: Use the graph below to answer the
Q100: The following graph shows the population (in
Q101: Use the graph below to answer the
Q102: The table shows starting salaries from a
Q103: On a recent test in a College