Short Answer
The following graph shows the population (in thousands) of two cities, City 1 and City 2.
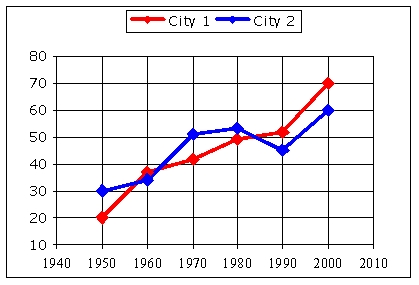 What was the difference in population (To the nearest 1,000.) between the two cities in 2000?
Correct Answer:

Verified
Correct Answer:
Verified
Related Questions
Q95: Use technology to graph the function and
Q96: Find the median of the data set
Q97: Find the domain for this function. Express
Q98: The following table shows data for the
Q99: Use the graph below to answer the
Q101: Use the graph below to answer the
Q102: The table shows starting salaries from a
Q103: On a recent test in a College
Q104: For the given equation <img src="https://d2lvgg3v3hfg70.cloudfront.net/TB9987/.jpg" alt="For
Q105: If Fancis pays 23% of each paycheck