Short Answer
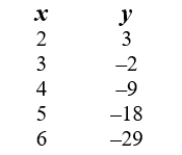
Find an equation that represents the relationship between x and y in this table:
Correct Answer:

Verified
Correct Answer:
Verified
Related Questions
Q116: On what interval is this graph increasing.
Q117: Use the graph to fill in the
Q118: The graph below shows the number of
Q119: Identify the maximum of this function over
Q120: Consider the table giving values for height
Q122: Based upon the scatterplot choose the answer
Q123: Solve the following equation for y in
Q124: Consider the table giving values for variables
Q125: Estimate (to the nearest integer) the maximum
Q126: On what interval is this graph decreasing.