Multiple Choice
The graph below shows the number of birds at a bird feeder as a function of time.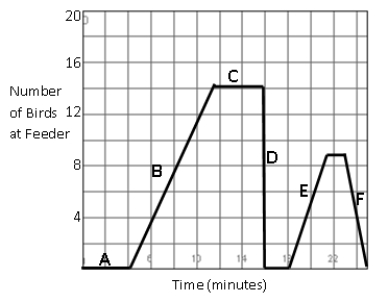
What event most likely occurred during interval E?
A) A cat chases all the birds away.
B) Birds are coming back after being chased away by a cat.
C) The feeder is full of birds and there is no room for more.
D) The feeder was still empty from the previous day.
Correct Answer:

Verified
Correct Answer:
Verified
Q113: In a group of seven people the
Q114: Use technology to graph the function and
Q115: Use technology to graph the function and
Q116: On what interval is this graph increasing.
Q117: Use the graph to fill in the
Q119: Identify the maximum of this function over
Q120: Consider the table giving values for height
Q121: Find an equation that represents the relationship
Q122: Based upon the scatterplot choose the answer
Q123: Solve the following equation for y in