Multiple Choice
Each of these tanks is being filled with a pipe that delivers 6 gallons of water per minute. Which graph best represents the height of the water in each tank as a function of time?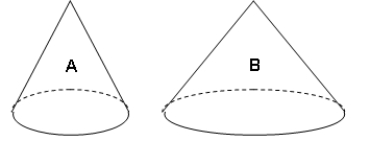
A) 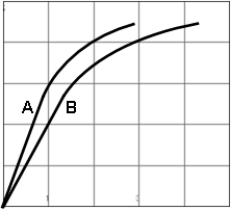
B) 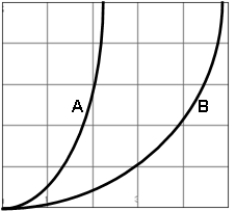
C) 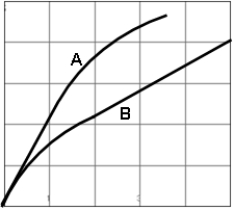
D) 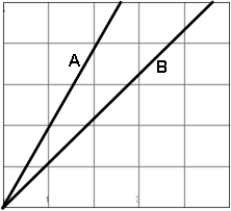
Correct Answer:

Verified
Correct Answer:
Verified
Related Questions
Q47: For the following data:<br>51, 47, 63, 59,
Q48: Over what interval(s) is the function positive?<br>Write
Q49: Determine if this table describes a function.<br><img
Q50: Solve the following equation for y in
Q51: The 2006 graduates of Bottom Line University
Q53: Find the domain of the function, <img
Q54: Find a formula that gives y in
Q55: The frequency table below describes the age
Q56: Use the bar chart below to find
Q57: Find the value that completes the ordered