Multiple Choice
Figure 4-14 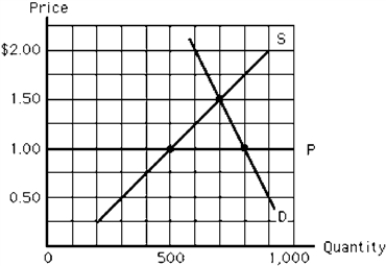
-In Figure 4-14, which of the following is true at the price ceiling, P?
A) The excess quantity supplied equals 300 gallons.
B) The excess quantity demanded equals 300 gallons.
C) The excess quantity supplied equals 500 gallons.
D) The excess quantity demanded equals 800 gallons.
E) Sales will be equal to 800 gallons.
Correct Answer:

Verified
Correct Answer:
Verified
Q250: If a government price control succeeds in
Q251: Figure 4-25 <img src="https://d2lvgg3v3hfg70.cloudfront.net/TB7348/.jpg" alt="Figure 4-25
Q252: In the supply and demand model, a
Q253: The Laffer curve indicates that<br>A) when tax
Q254: Taxes create deadweight losses because they<br>A) reduce
Q256: If a household has $40,000 in taxable
Q257: Other things constant, as the price of
Q258: The more elastic the supply of a
Q259: Use the figure below to answer the
Q260: Figure 4-22 <img src="https://d2lvgg3v3hfg70.cloudfront.net/TB7348/.jpg" alt="Figure 4-22