Multiple Choice
Figure 15-3
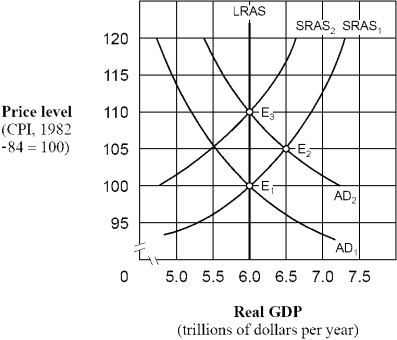
-As shown in Figure 15-3,if people behave according to adaptive expectations theory,an increase in the aggregate demand curve from AD₁ to AD₂ will cause the price level to move
A) directly from 100 to 110 and then remain at 110.
B) directly from 100 to 105 and then remain at 105.
C) from 100 to 105 initially and then eventually move back to 100.
D) from 100 to 105 initially and then eventually move to 110.
Correct Answer:

Verified
Correct Answer:
Verified
Q30: Figure 15-3<br> <img src="https://d2lvgg3v3hfg70.cloudfront.net/TB3951/.jpg" alt="Figure 15-3
Q31: Use the Modern Expectational Phillips curve diagram
Q39: During the 1960s,most economists believed macropolicy<br>A)that caused
Q70: If the government accelerates money supply growth
Q89: What are the proper monetary and fiscal
Q102: According to the adaptive expectations hypothesis,<br>A) inflation
Q121: Modern Phillips curve analysis indicates that if
Q147: Compared to the 1910-1960 period, economic fluctuations
Q160: The rational expectations hypothesis implies that use
Q169: When there is an abrupt increase in