Multiple Choice
Figure 15-3
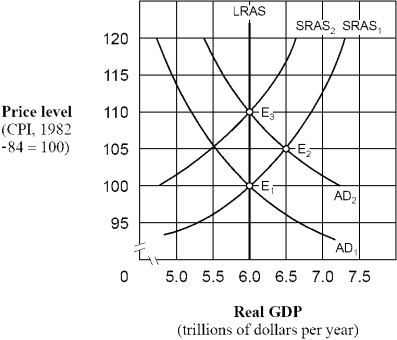
-As shown in Figure 15-3,if people behave according to adaptive expectations theory,an increase in the aggregate demand curve from AD₁ to AD₂ will cause
A) labor to adjust nominal wages sluggishly.
B) the aggregate supply curve to shift from SRAS₁ to SRAS₂
C) the price level to eventually rise from 100 to 110.
D) All of the above.
Correct Answer:

Verified
Correct Answer:
Verified
Q8: Starting from an initial long-run equilibrium, under
Q26: Use the table below to choose the
Q31: Use the Modern Expectational Phillips curve diagram
Q35: Figure 15-3<br> <img src="https://d2lvgg3v3hfg70.cloudfront.net/TB3951/.jpg" alt="Figure 15-3
Q36: The index of leading indicators was developed
Q70: If the government accelerates money supply growth
Q80: During the 1900-1950 period,<br>A) the growth of
Q101: Explain the three lags that make it
Q121: Modern Phillips curve analysis indicates that if
Q160: The rational expectations hypothesis implies that use