Multiple Choice
Use a table of values to graph the function 
A) 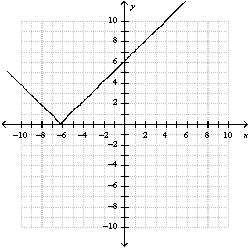
B) 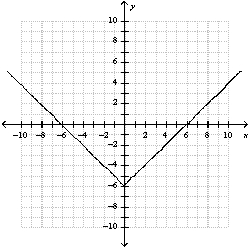
C) 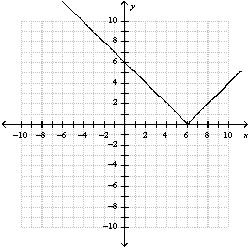
D) 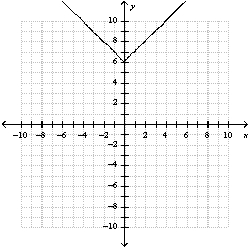
E) none of these
Correct Answer:

Verified
Correct Answer:
Verified
Q60: Use the graph of the function <img
Q61: Use the bar graph.<br>The bar graph shows
Q62: Which of the equations or inequalities represents
Q63: Change the function <img src="https://d2lvgg3v3hfg70.cloudfront.net/TB10230/.jpg" alt="Change the
Q64: A function is <img src="https://d2lvgg3v3hfg70.cloudfront.net/TB10230/.jpg" alt="A function
Q66: Use a table of ordered pairs to
Q67: Use interval notation to represent the range
Q68: In the function <img src="https://d2lvgg3v3hfg70.cloudfront.net/TB10230/.jpg" alt="In the
Q69: Use algebra to find any real zeros
Q70: Use the quadratic function n <img src="https://d2lvgg3v3hfg70.cloudfront.net/TB10230/.jpg"